How to run Grafana
This tutorial will show you how to install and run Grafana within a web app. Grafana is an open-source application for monitoring and analysis. More details about the application are available in its official documentation.
Prerequisites
Before you install Grafana, there are a few settings to check and configure on your hosting account.
- There must be a WebApps section in your hosting Control Panel. If you do not see a WebApps section, then this tutorial is not suitable for your particular hosting environment. You can contact us via our ticketing system for further assistance.
- SSH access and Network tools must be enabled for your account via the hosting Control Panel > SSH Access section.
Installation
To install Grafana as a web application, you should connect to your account via SSH and follow the steps listed below.
- Create a directory where Grafana will be installed (e.g. ~/private/grafana), and navigate to this directory with these commands:
mkdir /home/$USER/private/grafana
cd /home/$USER/private/grafana - Download the OSS edition of the standalone Linux binary for the latest version of Grafana from the official download page. At the time of writing this article, the latest version is 10.4.2, and the download link is https://dl.grafana.com/enterprise/release/grafana-enterprise-10.4.2.linux-amd64.tar.gz, so you can download it to your Grafana directory with these commands:
wget https://dl.grafana.com/enterprise/release/grafana-enterprise-10.4.2.linux-amd64.tar.gz
tar -zxf grafana-enterprise-10.4.2.linux-amd64.tar.gz --strip-components=1
rm grafana-enterprise-10.4.2.linux-amd64.tar.gz
Note: Make sure you use the link for the latest Grafana version for Linux in the above commands. - Create a file that starts the Grafana web application when the WebApps project is enabled, and add execution permissions to the file with these commands:
cat <<GRAFANA_START > /home/$USER/private/grafana/start.sh
#!/bin/bash
export GF_SERVER_HTTP_PORT=\$PORT
/home/$USER/private/grafana/bin/grafana server --homepath /home/$USER/private/grafana
GRAFANA_START
chmod +x /home/$USER/private/grafana/start.sh - Create the WebApp project for Grafana using the following command:
sureapp project create \
--engine "custom" \
--engine-version "-" \
--release-dir "/home/$USER/private/grafana/" \
--start-cmd "sh /home/$USER/private/grafana/start.sh" \
grafana - Choose the URL where you would like to access the Grafana application via the WebApps section of the hosting Control Panel by clicking on the Edit button next to the grafana web application. Select the domain and subdomain where Grafana will run via the available drop-down menus on the screen that appears. Finally, save the changes..
- Start the application by clicking on the Enable button.
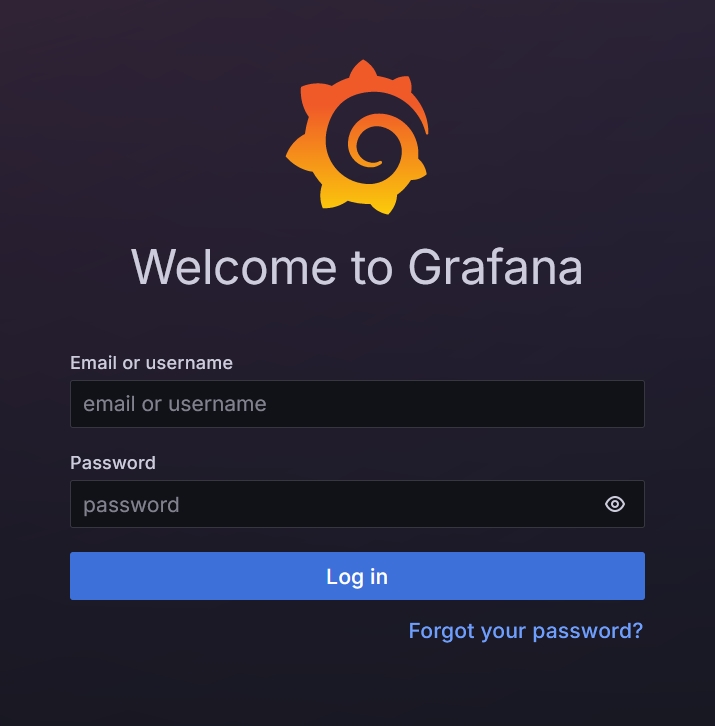
- Open the URL of the Grafana application (e.g. http://grafana.example.com), and you should see the login page for the administrative dashboard. You can use admin as both username and password to log in for the first time, and we strongly encourage you to change your password at your earliest convenience.
